
Open Interest for
Advanced Analysis
Decode market sentiment instantly with live Open Interest and Put-Call Ratios
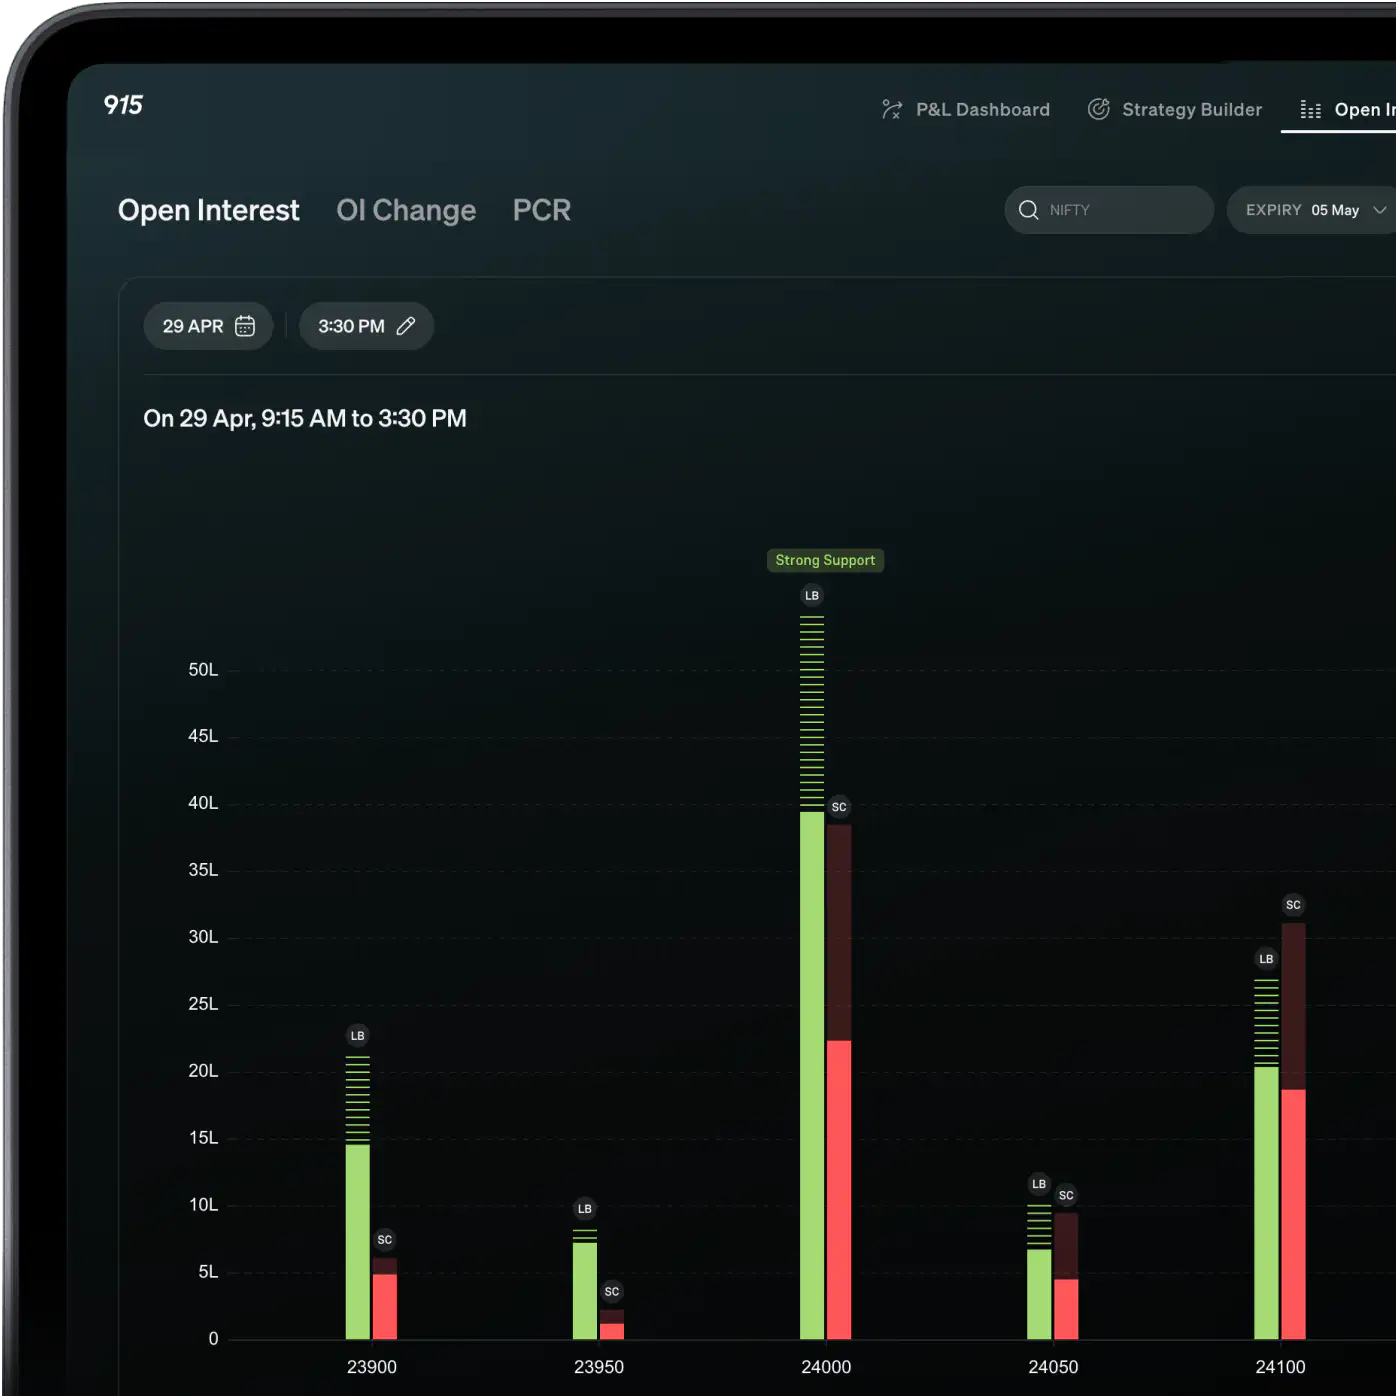

Advanced Tools. Clearer OI Insights.
Get a bird's-eye view of the market signals. Aggregated price action, OI shifts, and Live PCR.
Open Interest
Strike level OI data with custom timeframe and expiry filters
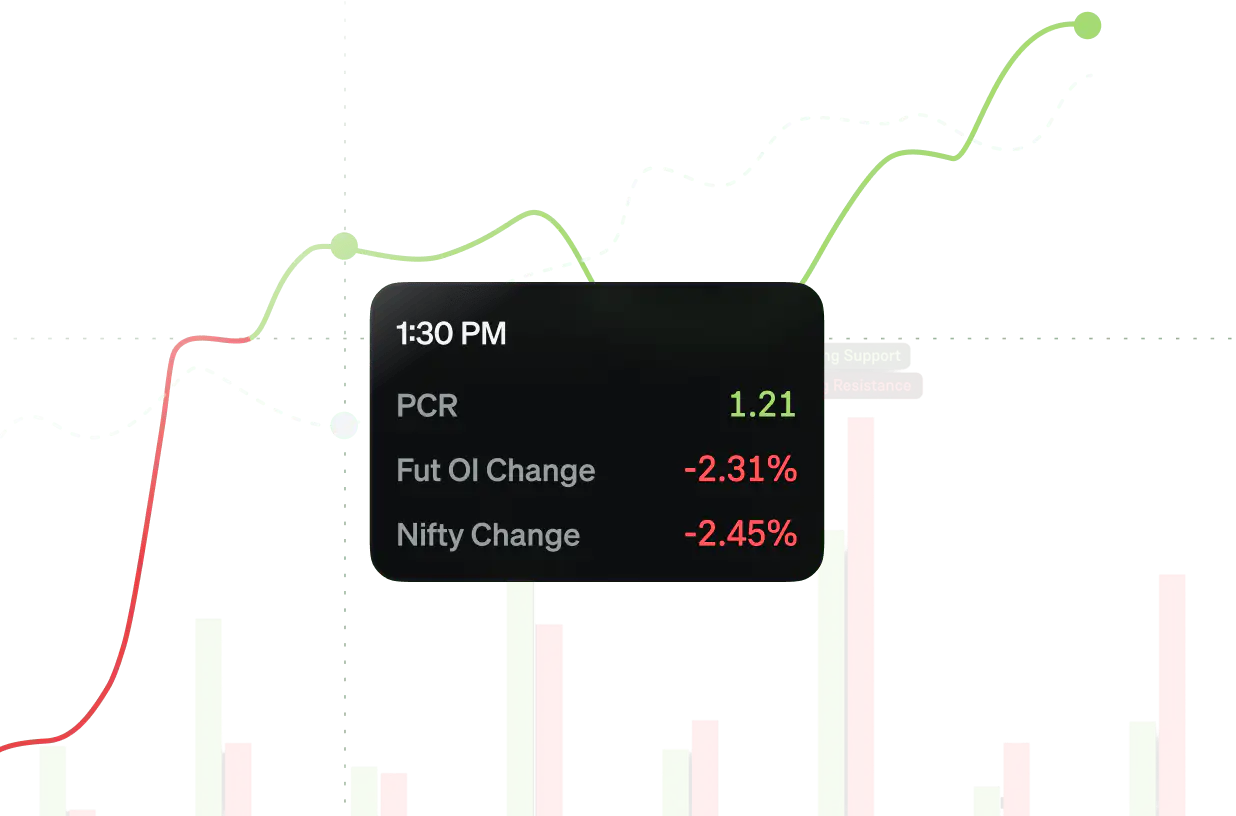
Live PCR Insights
Gauge market sentiment using realtime PCR chart with live intraday and historical data
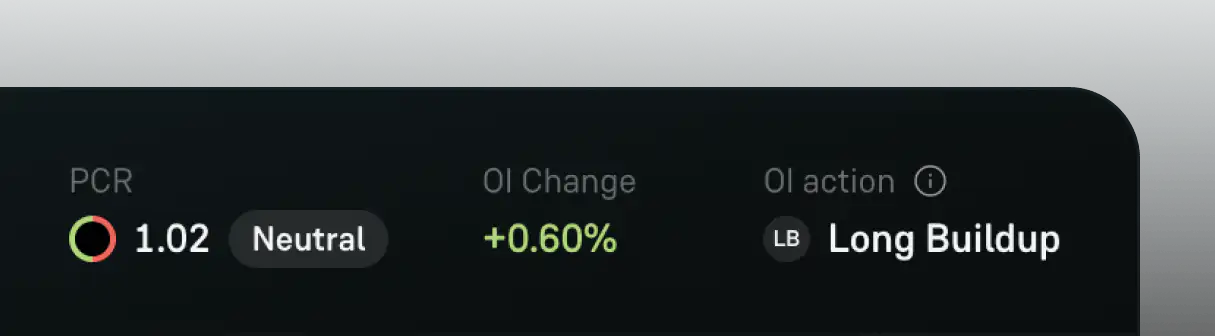
Global Sentiment View
Quickly analyse underlying asset's overall sentiment
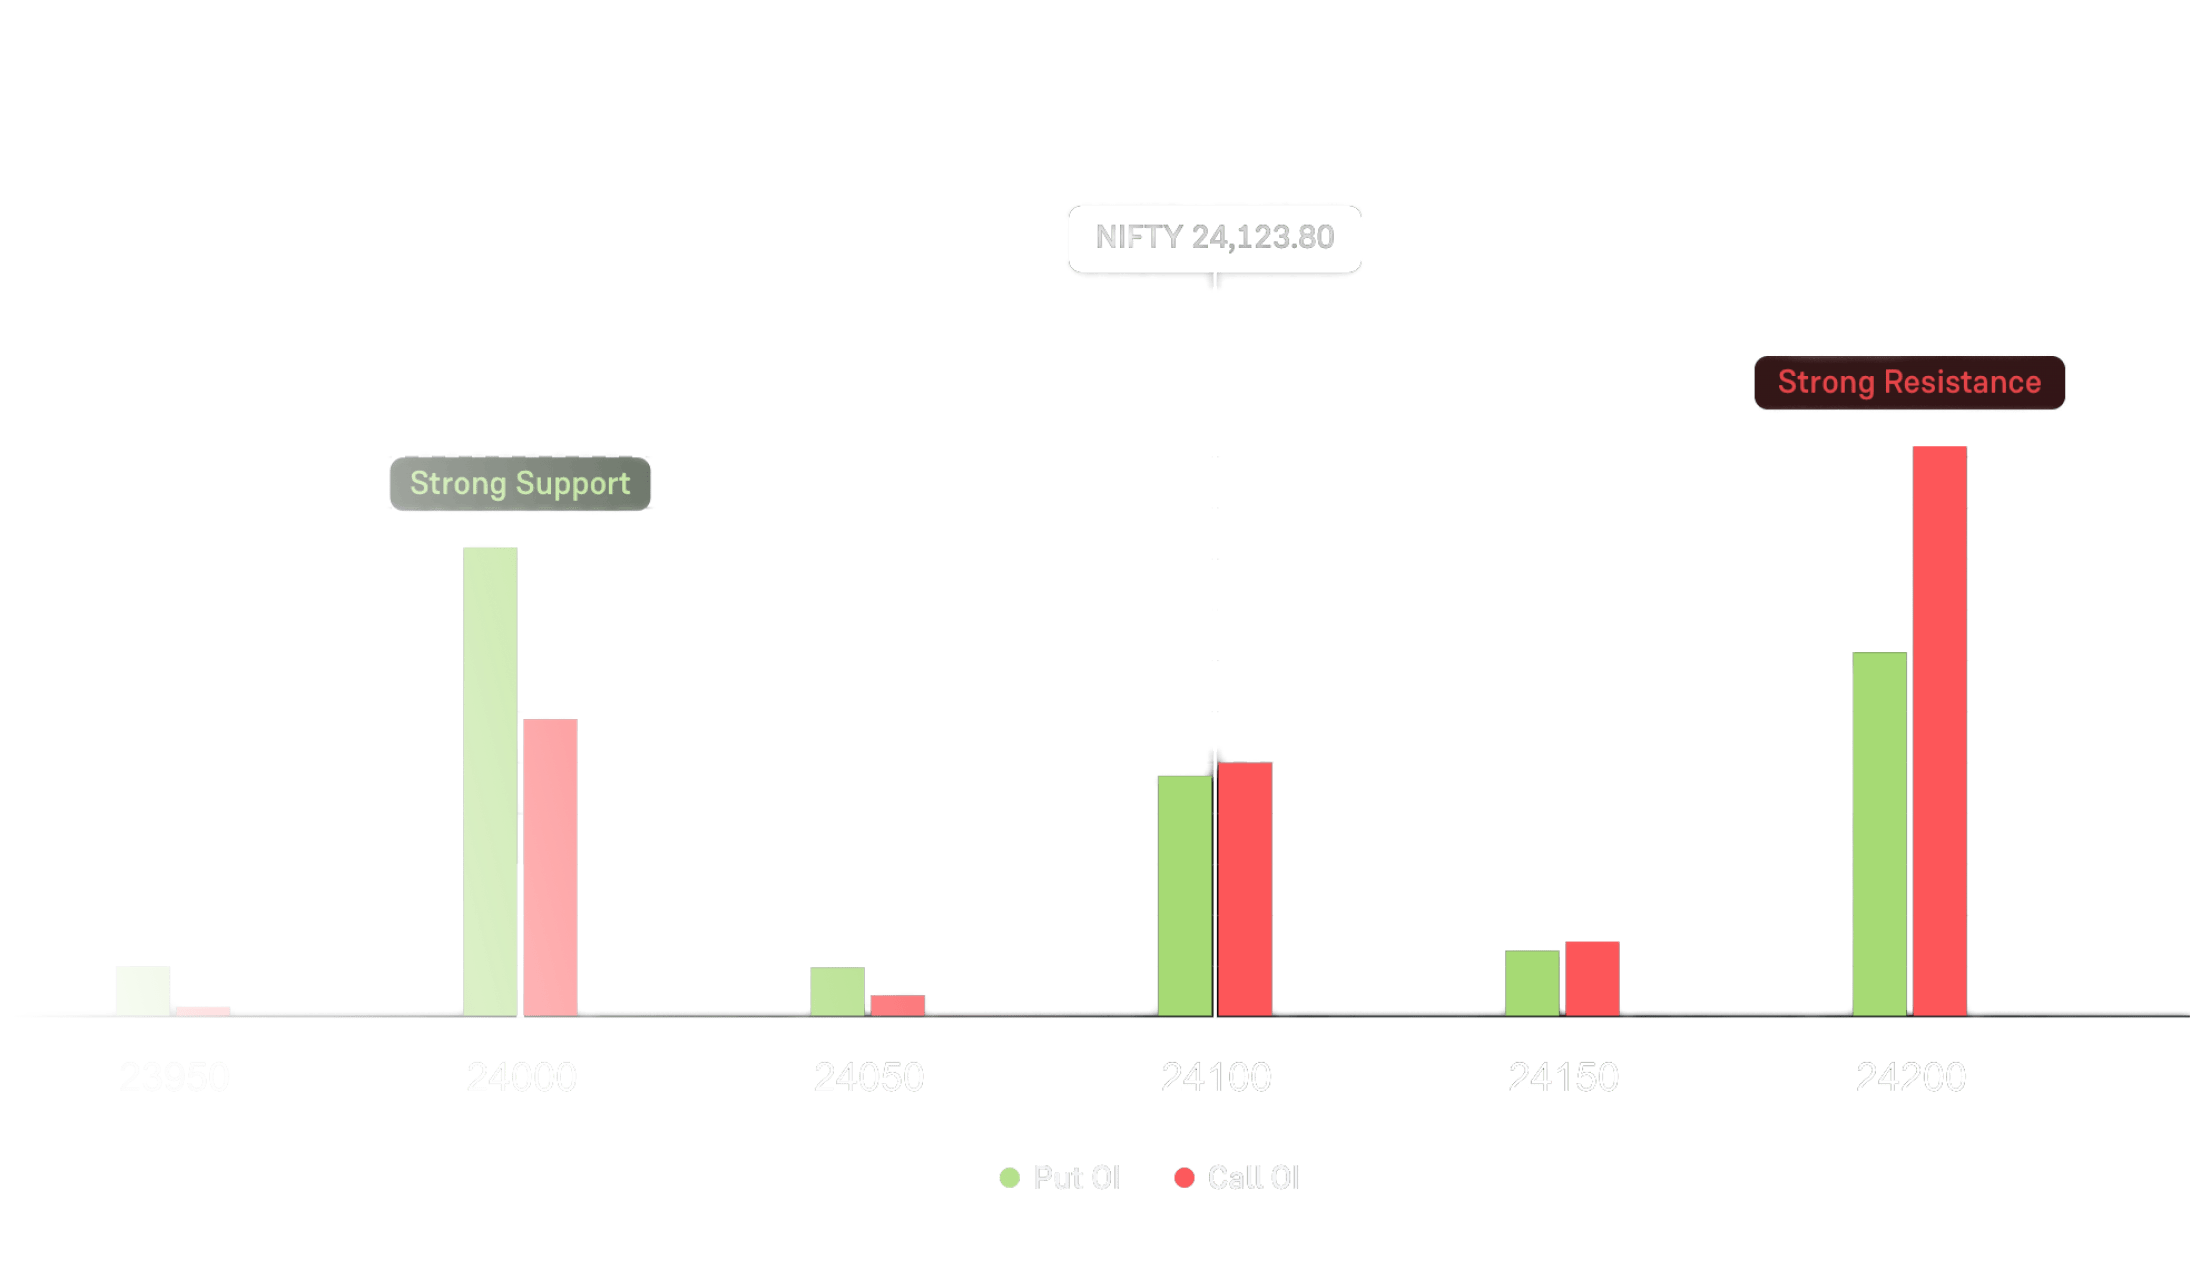
Support & Resistance
Easily view strikes with max Call and Put Open Interest
OI Change
Understand changing market interest and identify actions at strike level with various filters
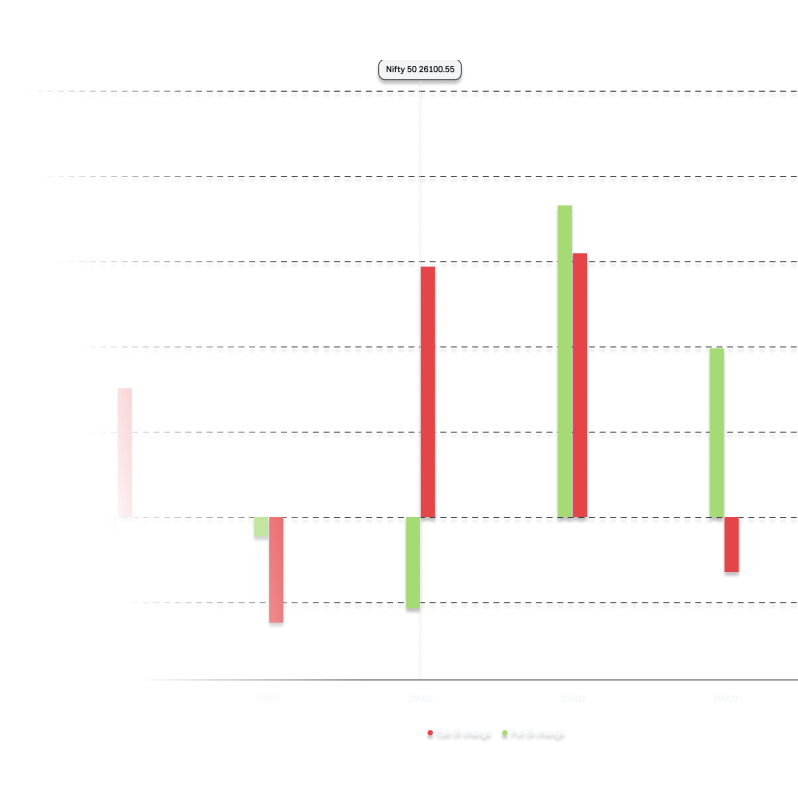
OI Actions
Identify actions like long buildup, short buildup, short covering and long unwinding easily at strike level

Open Interest and OI Change Chart
Visualise Support & Resistance levels like a Pro. Track the 'Smart Money' in real-time.
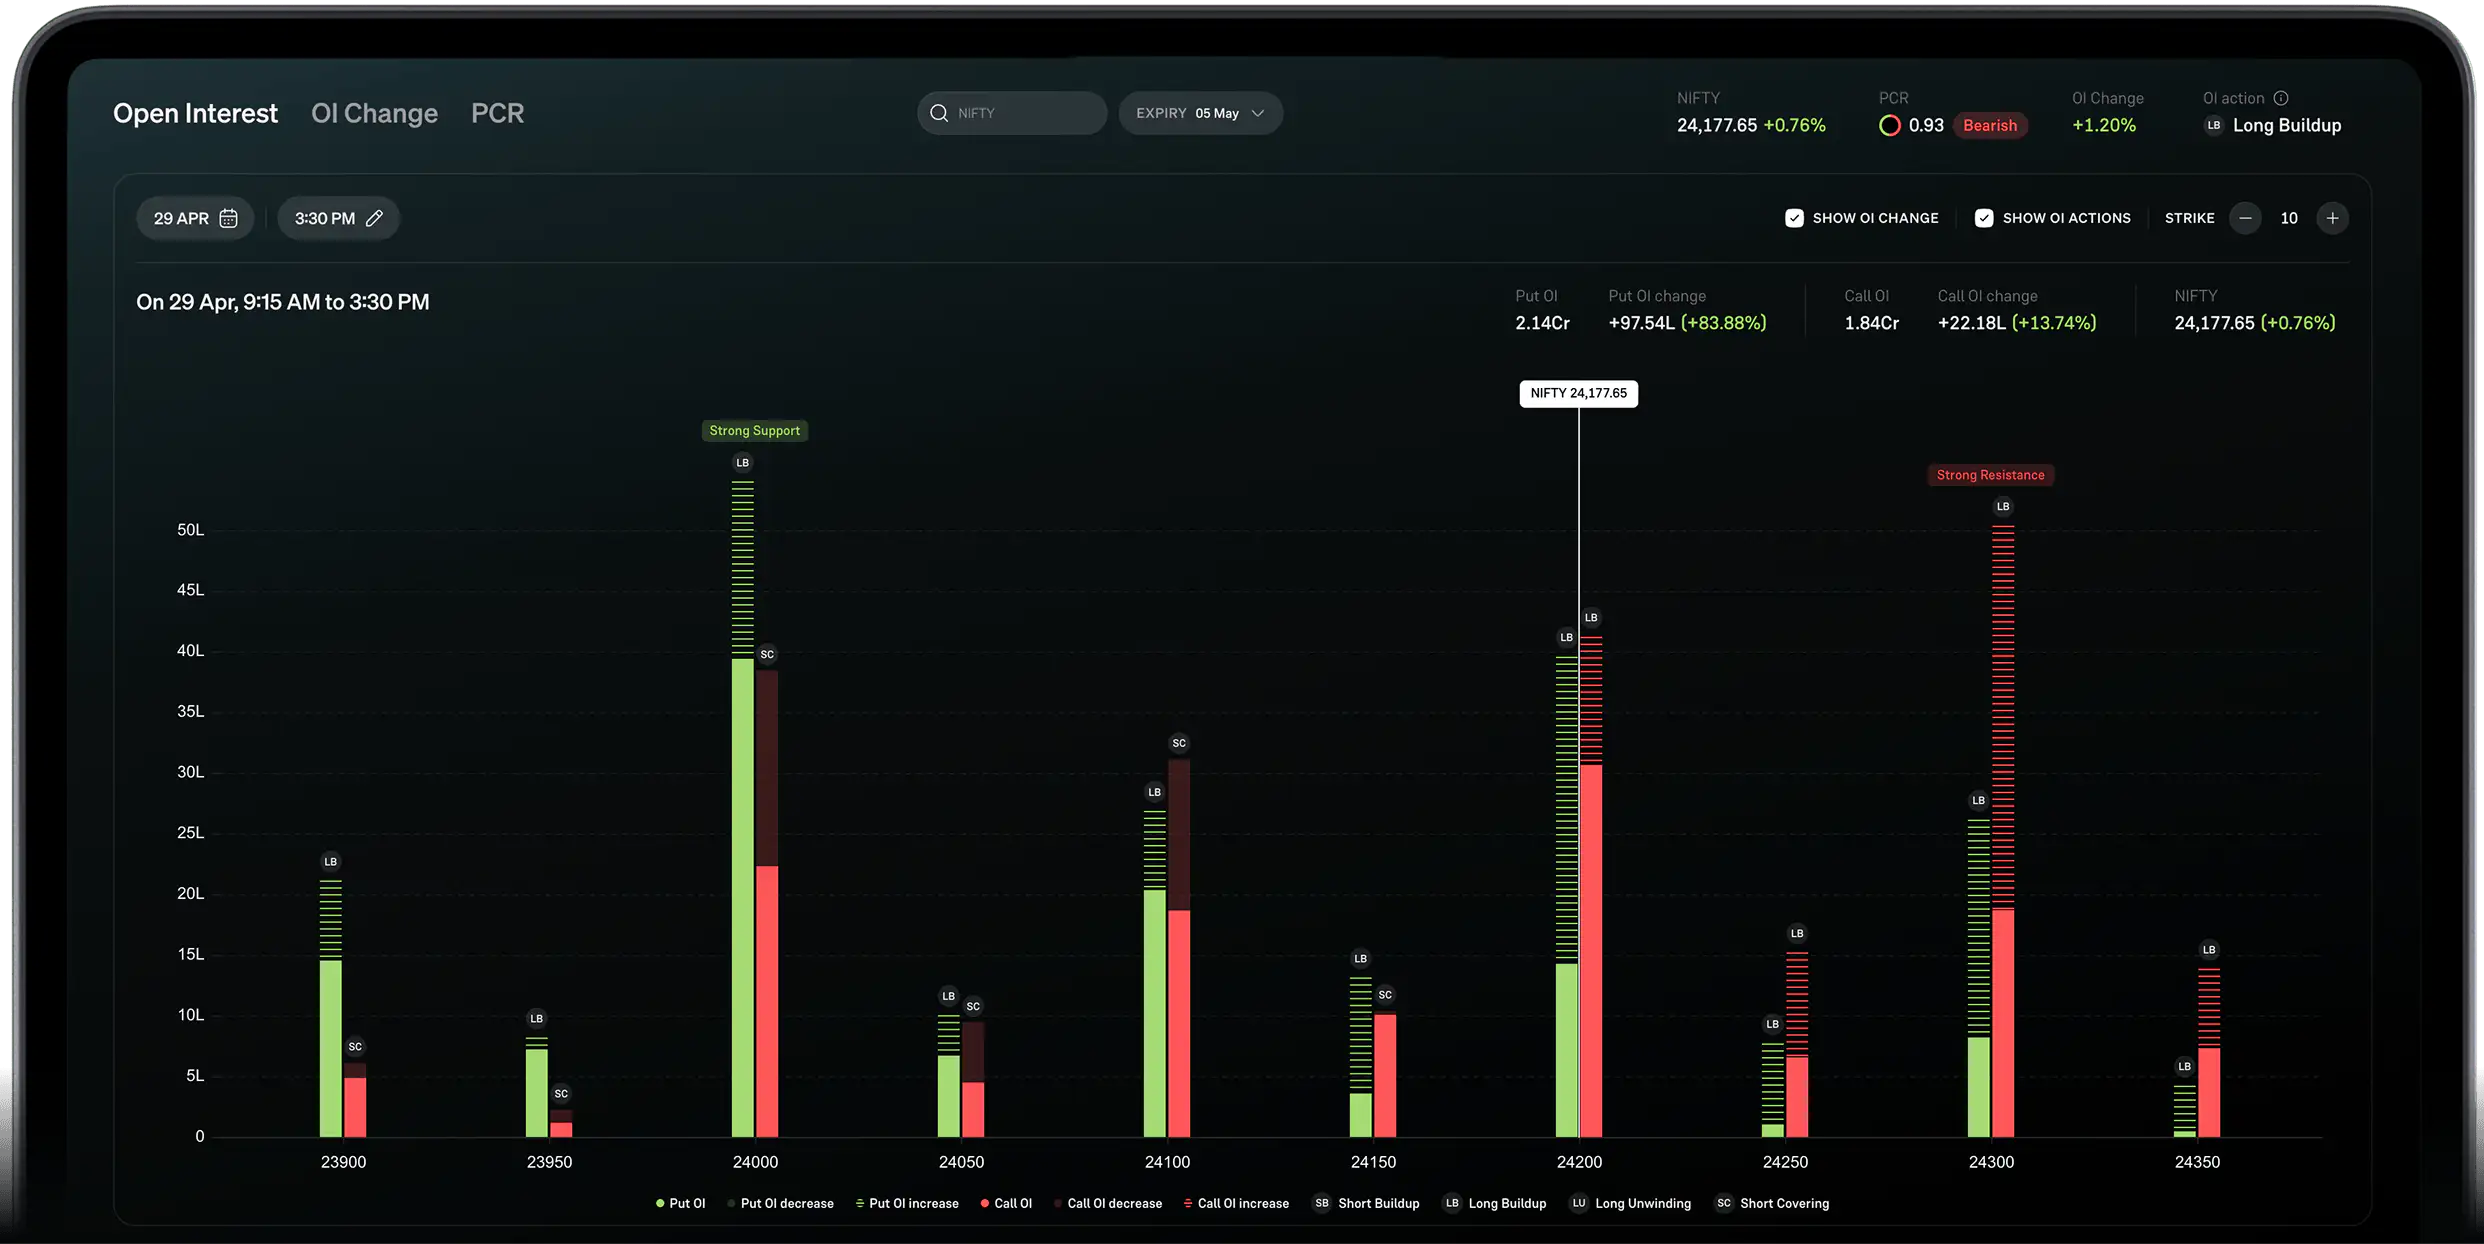
Strike level Intelligence
Identify high-conviction strikes and compare them instantly
Support & Resistance
Precisely track where the highest Call and Put Open Interest sit directly on the chart
Intraday Time Sliders
Customise your view to see Open Interest shifts over the last 5, 10, 15, 30 or custom duration
Multi-Expiry View
Analyse the current week alongside monthly expiries to spot long-term positioning
Historical Context
Go back in time to see how Open Interest evolved during previous market cycles
Spot the Breakouts
Identify sudden spikes in Open Interest change that often precede big price moves
Live PCR Insights
Use PCR trends to track positioning shifts and anticipate breakout or reversal setups
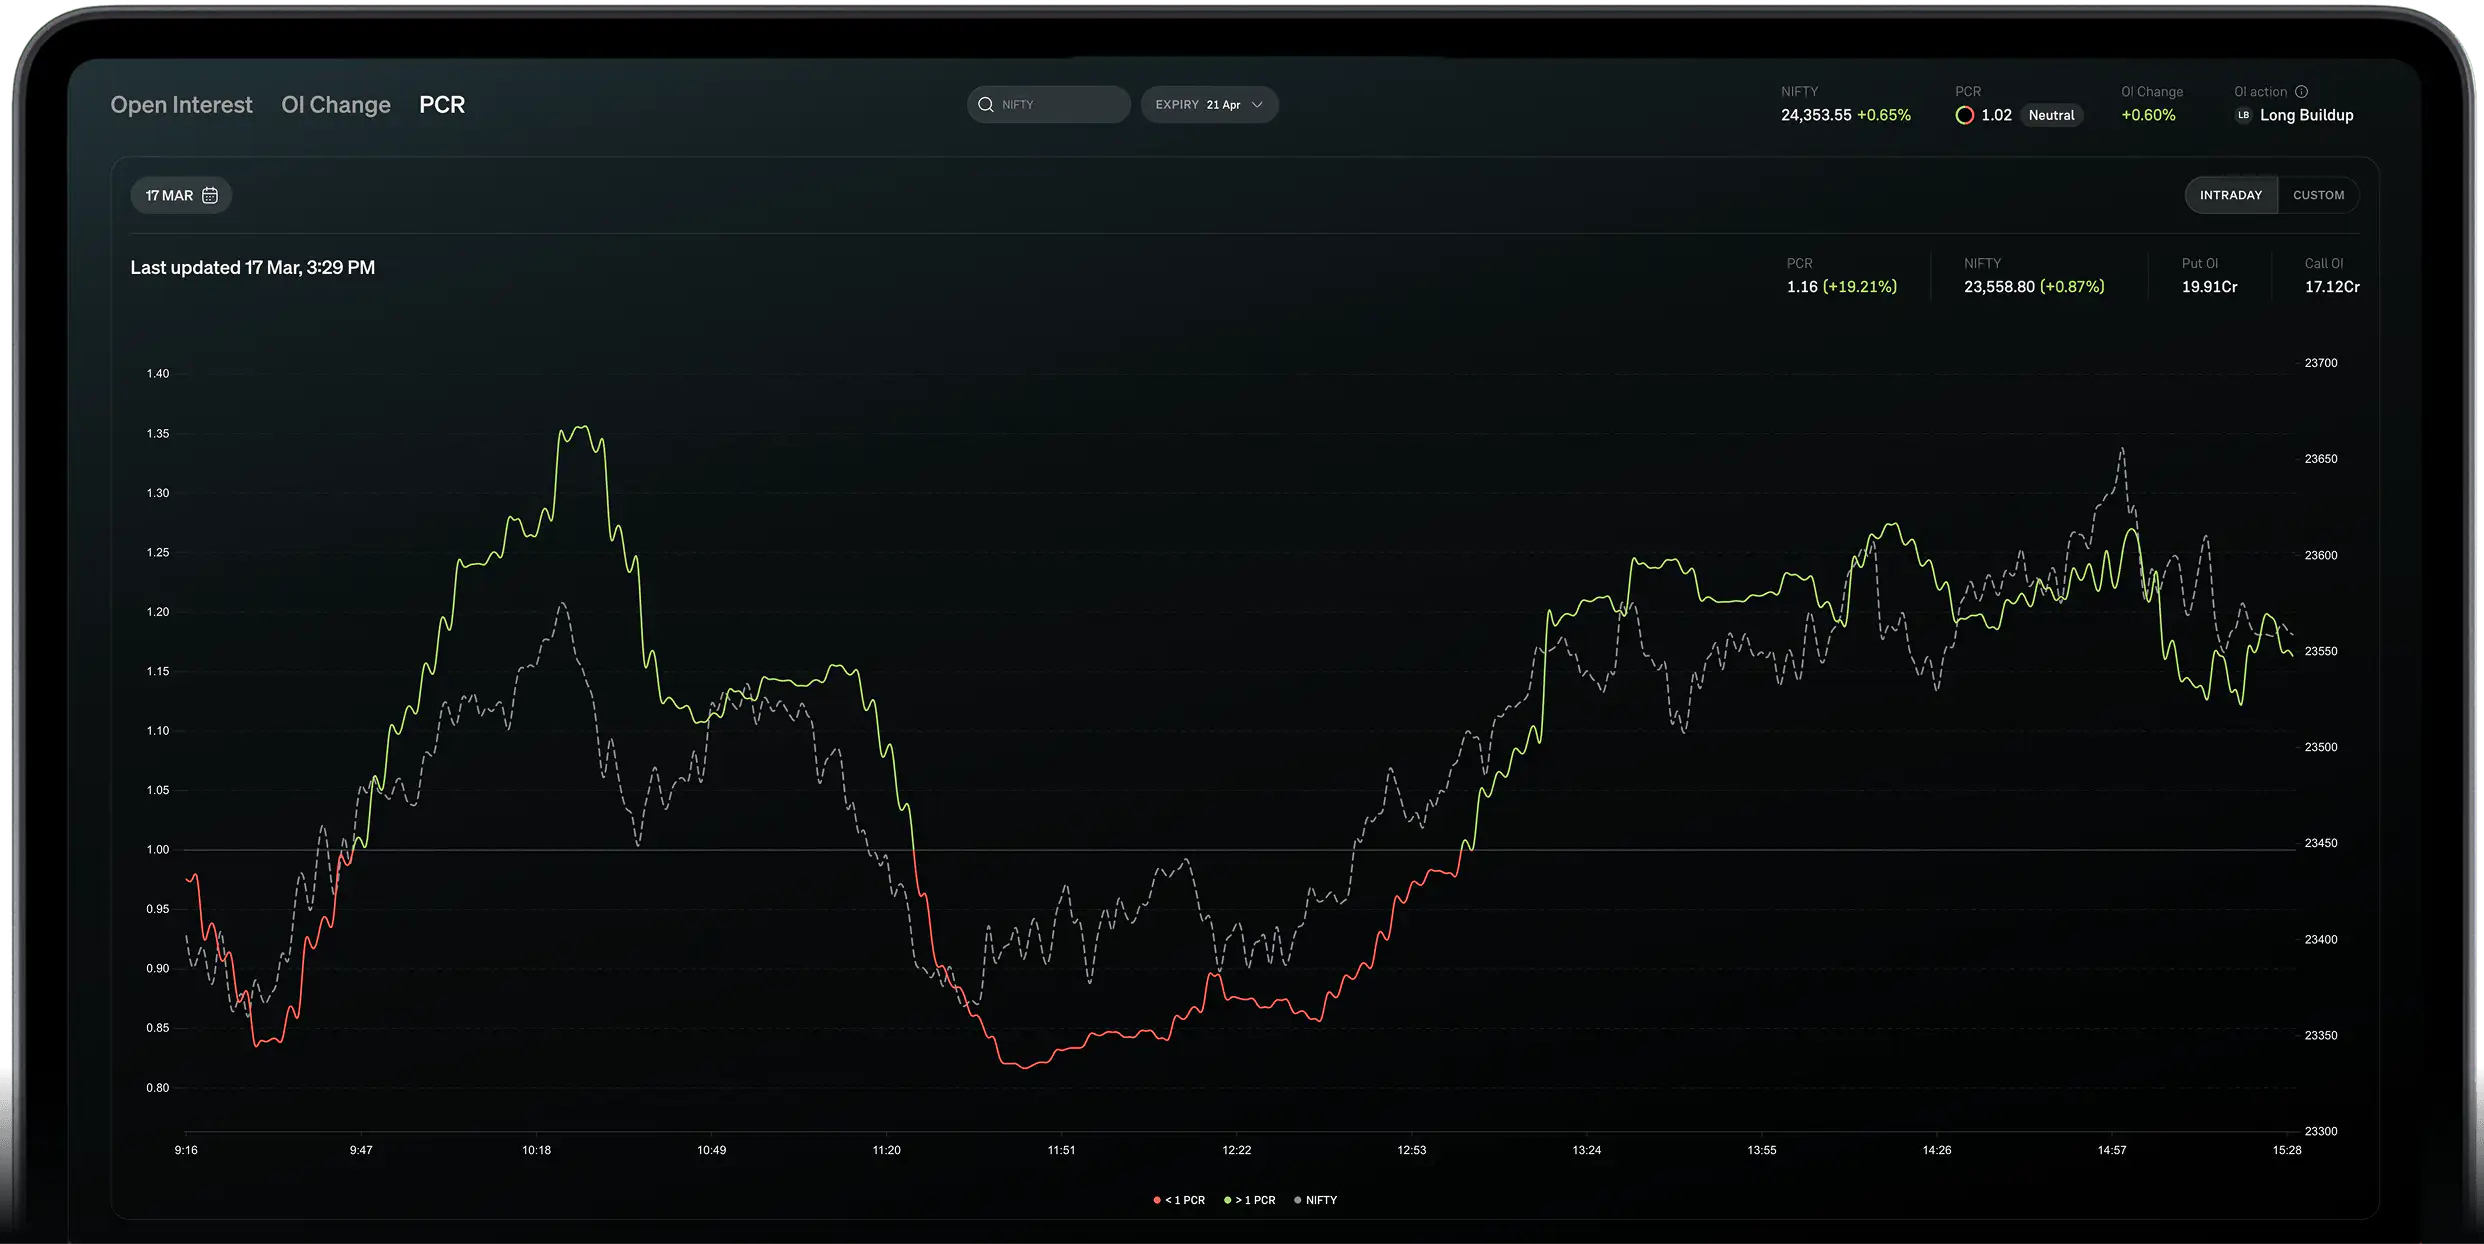
Minute-by-Minute Tracking
Watch Intraday sentiment shifts with granular accuracy
Long term Analysis
View PCR trend over days/weeks/custom range to identify macro shifts in market sentiment
Quick Indicators
Quickly view bullish (>1) and bearish (<1) sentiments with visual indicators on chart

915 on YouTube
Watch quick tutorials to explore features, optimise your setup, and trade with greater control


Frequently Asked Questions
What is Open Interest (OI) in options trading?
What is the change in Open Interest (OI Change)?
What is the Put-Call Ratio (PCR)?
High PCR: Market may be oversold or turning bullish
Low PCR: Market may be overbought or turning bearish
How can I identify support and resistance using the Open Interest chart?
How is OI different from volume?
How do I use OI to identify bullish or bearish trends?
- Long Buildup (Bullish): Price ↑ + OI ↑
- Short Buildup (Bearish): Price ↓ + OI ↑
- Short Covering (Bullish): Price ↑ + OI ↓
- Long Unwinding (Bearish): Price ↓ + OI ↓
Why is the OI change important for intraday trading?
- Spot potential breakouts early
- Identify strong support/resistance zones forming
- Track real-time sentiment shifts
Can Open Interest be zero?
How do I use PCR effectively?
- Rising PCR + stable price → Potential bullish buildup
- Falling PCR + rising price → Possible overbought signal
Can I track OI and PCR historically?
Advanced Open Interest Analysis
Stop guessing and start interpreting the market movements
Vaishnavi Tech Park, South Tower, 3rd Floor Sarjapur Main Road, Bellandur Bengaluru – 560103, Karnataka



Disclaimer: Investments in securities market are subject to market risks, read all the related documents carefully before investing. Groww Invest Tech Pvt Ltd is a member of BSE Membership ID - 6699, NSE Membership ID - 90187, MCX Membership ID - 57420 with SEBI Reg. no: INZ000301838 having registered office at VTP, 3rd floor, Sarjapur Main Road, Bellandur, Bengaluru - 560103. The securities are quoted as an example not as a recommendation.
© 2026 915 by Groww. All rights reserved.
